Cyclone Gabrielle
- Earthling

- Feb 17, 2023
- 3 min read
Updated: Feb 17, 2023
Cyclone Gabrielle will go down as one of the most devastating weather events in New Zealand's modern history which affected many parts of the North Island. Here is a meteorological summary timeline of how the perfect storm unfolded.
05 Feb – Deep convection develops around low level circulation centre north of Vanuatu, commencing a westward track towards the Solomon Islands.
06 Feb - Tropical low named by JTWC as 99P

07 Feb - Australian Bureau of Meteorology named the tropical low 14U with a forecast track steering south-east into through the Coral Sea towards Norfolk Island.

08 Feb - Australian Bureau of Meteorology upgrade tropical low 14U to tropical cyclone Gabrielle. The track was well away from Australia and New Caledonia but Norfolk Island was directly in Gabrielle's path when she exits the tropics.
10 Feb - TC Gabrielle started to undergo a strong intensification phase with an eye and eyewall lightning appearing. Soon afterward, Gabrielle was upgraded to a severe category 3 cyclone by the BoM.

Microwave imagery also showing the developing eyewall.
11 Feb - First signs of Gabrielle start appearing over the upper North Island with cirrus outflow trigger 22°c sun halos in the morning sky.


By nightfall the first of Gabrielle's rainbands arrive across Northland.
12 Feb - Early morning Gabrielle moved over Norfolk Island with pressure bottoming at 958.0 hPa. Water vapour imagery displaying that Gabrielle is starting to develop a scorpion tail 'sting jet' signature as it transitions to becoming a strong extratropical cyclone on its way to the North Island.
MetService issue RED warning for heavy rain and severe gales across Northland, Auckland, The Coromandel, Great Barrier Island and Gisborne.
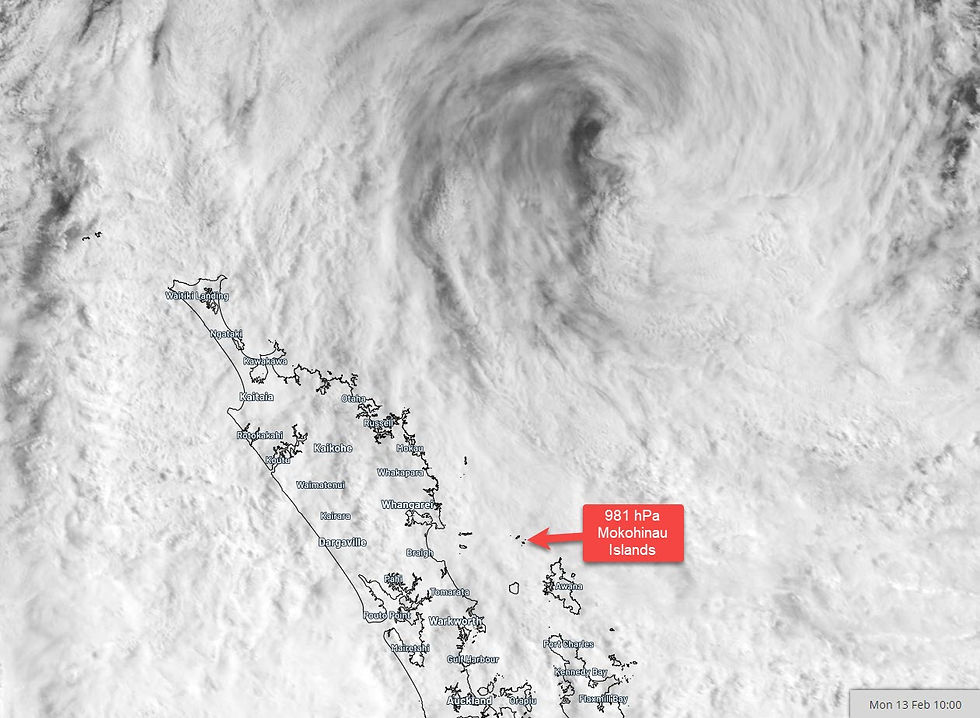
13 Feb - Strong winds, heavy rain and rapid falling air pressure commences across all areas of the upper North Island.

By 10:00am the satellite image shows Gabrielle is now on the doorstep, 200km north of Great Barrier Island.
By 4:00pm the satellite image shows Gabrielle within 100km north of Great Barrier Island with pressure in the 970's on the southern quadrant of the cyclone.

At 8:50pm Great Barrier Island had dropped into the 960's, eventually bottoming at 965.4 hPa at 3am on 14 February.
14 Feb - Intense spiral rainbands wrapped around from Gabrielle's centre into the Coromandel, Auckland and Northland with devasting flooding especially on Auckland's and Northland's west coasts.

By late afternoon severe gale force wind came in from the south-west, causing power outages across many parts of the North Island. Significant heavy rain hit the Gisborne, Hawkes Bay and Napier areas. The death toll and costs of the cyclone rises by the day, a further update will be included when this becomes more clear.
48 hour satellite sequence showed how the cyclones path produces the largest impacting storm of the 21st century so far for NZ
Notable stats for the upper North Island from private & public sources.
Highest accumulated rainfall from 12th February
Northland- 544mm Puwera (10km south of Whangarei) Coromandel - 614mm The Pinnacles , 382mm Matarangi Auckland - 370mm Piha Great Barrier Island 212mm (Awana Beach)
Highest wind gust 163km/h (88 knots) Channel Island
Lowest barometric air pressure 965.4 Claris airport, Great Barrier Island
Weather models performed very well in the week leading up to the event, picking up early how extreme the cyclone was going to be. 72 hours from the cyclone's centre next to the upper North, the UK model projected an almost perfect forecast for placement, pressure an change of direction.

Cyclone Gabrielle now has its own historical cyclone page here


Comments