top of page

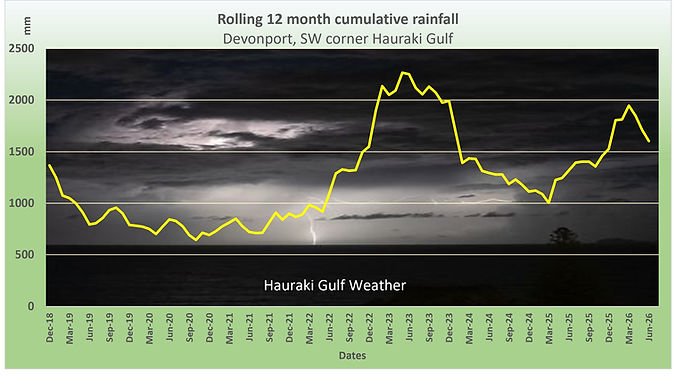
Annual rainfall for 2025 was 1528.0 which is 300mm above the 2018/24 average. The current linear trend is upward.
Updated 1st January 2026
Rain data
2018-25
Ave
83.8
92.3
62.6
100.6
125.2
143.4
140.9
111.4
106.0
89.8
90.9
95.4
1241.2
Year
Jan
Feb
Mar
Apr
May
Jun
Jul
Aug
Sep
Oct
Nov
Dec
Annual
2018
135.2
193.5
65.8
127.7
132.5
190.0
90.5
104.4
43.8
51.4
85.0
146.8
1366.6
2019
17.6
19.0
40.8
76.4
46.0
72.4
102.4
156.0
118.4
77.2
27.6
35.0
2020
9.4
11.0
19.4
25.6
116.6
142.8
87.8
106.6
32.0
29.6
96.6
13.2
2021
45.8
61.8
52.4
64.6
42.6
87.4
77.6
109.4
132.4
125.6
27.6
72.4
2022
13.0
85.8
142.6
43.4
88.4
167.2
279.8
147.8
120.2
132.0
203.2
126.4
2023
358.4
325.2
57.6
85.2
263.2
151.8
146.6
86.4
195.0
73.0
106.6
143.4
2024
57.6
24.6
100.8
80.6
145.4
132.2
133.4
85.4
102.2
117.4
55.8
78.6
2025
33.0
17.6
21.6
301.2
167.0
203.4
209.0
95.0
103.6
104.6
125.0
147.0
2026
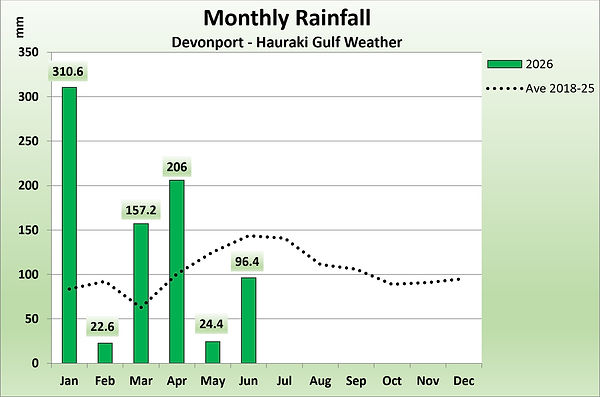
310.6
22.6
157.2
206
24.4
96.4
*
*
*
**
*
*
788.8
690.6
899.6
1549.8
1992.4
1114.0
1528.0
817.2
Updated 1st July 2026
bottom of page